Shri Gurubhyo Namaha
Thanking the Gurus who have shared their knowledge on internet and books
Source: Internet, books, youtube, Prof. Park Jae Woo, Dr. Uma Rao Ma’am, Dr. Tharakeshwari
Link to Sujok Seed Therapy doc by Prof. Park Jae Woo
Dr. Tharakeshwari's Seed Therapy Youtube link
ॐ नमामि धन्वन्तरिं आदिदेवम I सुरासुर वन्दिते पद पद्मम् II
लोके जरा रुक् भय मृत्यु नाशनम् I धतर्मिशम् विविध औषधिनाम् II
Dhanvantri - God of Ayurveda, holding a shankha, chakra, leeches, chakra and amrita kalasha. He is the dispeller of all sufferings.
Now tell me what is special about babies - unique to them!
Seeds have life and energy. When we intake seeds, it gives energy to our organs and when fixed in our palm, they transfer energy through the pranic channel and the interstitial fluid. What is interstitial fluid?
How do seeds grow? With sunlight from outside, through water conducted under the soil. So, under the right conditions of temperature, moisture and sunlight, seeds can grow into a new plant, so they are considered as living things. Seed-water affinity-sprouts-water searcher-its and our prana enhance.
Seeds are natural simulators to acupressure points and are also part of Sujok therapy. And so they are used as healers as they are embedded with energy to manifest into a new plant. They are used to act as stimulator to the pressure points - gives relief from the condition that one is suffering from. Pebbles, twigs, leaves, petals, seeds, etc. may also be applied. By the principle of similarity, the impact of natural materials will be more effective than artificial stimulators.
1988 – First presented by Prof. Park Jae Woo, a year after Korean Sujok Therapy.
This therapeutic system functions as an electric circuit generating electromagnetic waves that occurs in an affected part of body or organ as a result of the disturbance of energy flow or circulation. These waves travel simultaneously in all directions, especially in the area the most resonating with the given organ/ body part.
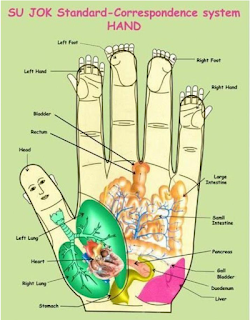
Sujok points are used for seed therapy. The reflex points of the internal organs are found in the palm, hence we apply seeds to these points to heal the self.
Seeds = Life energy + five elements energy just like us
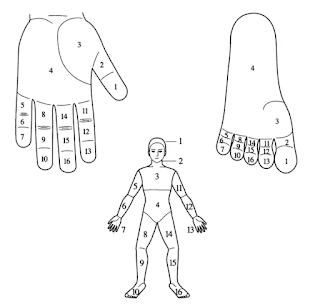
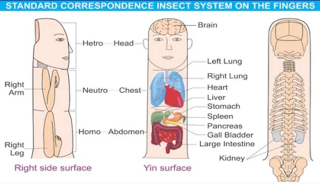
First let us understand our organ system and their correspondence in our palm and fingers.
Identifying the point
Seeds are applied to the areas corresponding to the affected organs
Identify the ouch point(most painful point)
Attach seeds to adhesive tape(micropore tape from a medical shop)
Fix it on the hand or foot correspondence of the affected organ
For chronic condition - seed at rest, seeds of herbs, seeds of gymnosperms plants(exposed naked seed - conifer) may be used
For acute condition - a germinating seed, dicotyledon(legumes) or arboreal seed (pertaining to tree) may be used
For harmonising - monocotyledons may be used - of cereals
Excellent link for condition-wise/disease-wise list of acupressure treatment points -
https://www.acusansthan-ald.in/one-point-acupressure-treatment#top
Seed’s Nature | Seeds suitable |
Hotness | Pepper, mustard, Horse Gram(kollu) |
Coldness | Methi(Fenugreek), Green gram, Castor seeds |
Gastric | Cow pea(thattai payiru), Rajma, Chickpea |
Balancing | Soya beans, Red Vaadha narayana seeds(red lucky seeds/saga) |
Note: Red lucky seed, famous in kerala temples (manjadikuru) is toxic when taken raw, should be eaten only when cooked.
For how many days should one do seed therapy for best results?
Age in years | Seed therapy (Count in days) | Hours per day |
Children upto 10 | Number of days = their age | Max. 2 hours only |
10 to 20 | Number of days = their age | Max. 3 hours daily |
20 to 48 | 48 days | Min. 4 - 8 hours daily |
> 48 | Number of days = their age | Min. 4 - 8 hours daily |
Pepper should be just 1, 2 or 3 not more than that as it will increase heat in the body
For people prone to sinus, avoid fenugreek seeds in thumb
Do not use pepper and mustard seeds simultaneously, unless recommended
For best results, include pranayama to seed therapy
Sense organs and all the nerves are driven by the air-element, hence pranayama will provide more relief and faster healing.
Note - Pain in the face excruciating than any other part of the body as it is the air-zone and hence any condition to the face region(sinus, mouth ulcer, ear-ache, sore throat, etc.) will seem more painful than damage to any other part of the body and will be accompanied with headache most times. Best medicine is 5-6 rounds of simple anulom-vilom and 3-4 rounds of any cooling pranayama. (Personal experience).
Seeds only on left hand
Use micropore tape 1 inch (3M)
Seeds should not come in contact with water
Seeds not be reused
Seeds should not be applied during periods or pregnancy
Seeds may be kept during nights also. If during day, consider wearing gloves to avoid contact with water
In a span of 24 hours, apply seeds for maximum upto 8 hours.(refer table for day count). Then, repeat after 12 hours.
So, let us start taping seeds from thumb tip and observe what all it can heal as we go all the way till the finger tips.
Seeds - location on palm | Condition |
| Fits, Edema in head, coldness in head, paralysis, memory loss, regulation of blood circulation, relief from coma |
Thumb front side top portion - methi seeds | Hair fall, reduce hotness, Dandruff |
| Sudden loss of eye vision, myopia, hyperopia, eye strain, watery eyes, eye nerve pain, cataract, eye pressure |
| Deafness, fluid in ear, Tinnitus, noise in the ear, vertigo, Ear pain due to thyroid |
| Nose blockage, nose bleeding, sinus, breathing difficulties, nose muscle growth, nose bone pain |
Thumb front side mouth part - methi seeds | Lip sores, inflammation, dryness in eyes, mouth ulcers |
Seeds | Condition |
| Thyroid, Tonsillitis, cough, throat infection, hormone imbalance, weight loss, neck pain |
Fix 4-5 peas vertically at the back of the thumb below nail depending on the cervical count | Cervical pain |
| Chest pain, cholesterol reduction, breathing problem, asthma, cough, chest, congestion, paralysis, palpitation |
Fix some methi or mustard seed in the spleen point in your palm | Diabetes, blood purification, stomach pain, menstrual problems, indigestion, vomiting, diarrhea, appetite, excess hunger |
Seeds - location on palm | Condition |
| Disease Free (Just like Apana Vayu mudra) Stress-free, Energy to brain, telepathy Also Pineal Gland treatment |
| Fever in winter - first confirm fever is because of the weather (lungs focus being winter) - Soak/Bathe in rock/sea salt warm water |
| Full body pain Or only Front body pain or only back body pain Soak/Bathe in rock/sea salt warm water |
| Allergy, Skin disease Note: Skin - needs to be hydrated, it is a sense organ and driven by the air (vayu) element - address all of them using seeds |
Day 1:
Day 2:
| Energy to Endocrine system, energy to knees, bones, heal arthritis |
Seeds - location on palm | Condition |
| Sciatica, L4-L5 pain, Hip pain Soak/Bathe in rock/sea salt warm water |
| Calcium Deficiency, Uterus fibroid, uterus related etc. |
| Insomnia/Headache/Increase energy |
| Thyroid treatment |
| Pancreas Treatment |
| Adrenal Glands |
Condition | Seeds |
Anemia | peas |
Asthma, Bronchitis | Rice |
Arthritis, Inflammation, Spasm, Paralysis | Red lucky seed(Manjadi Kuru) |
Constipation, toothache | Flax, cumin seeds |
Diabetes, epilepsy | Corn |
Eye inflammation | Marigold |
Fractures | Red burning pepper seeds |
General weakening of the system | Round pea seeds at chakra points inner palm |
Hearing and Vision | Pomegranate seeds |
Haemorrhoids, gout | Barley |